

Oct 27, 2025
IndexBox has just published a new report: China – Golf Clubs And Other Golf Equipment – Market Analysis, Forecast, Size, Trends and Insights.
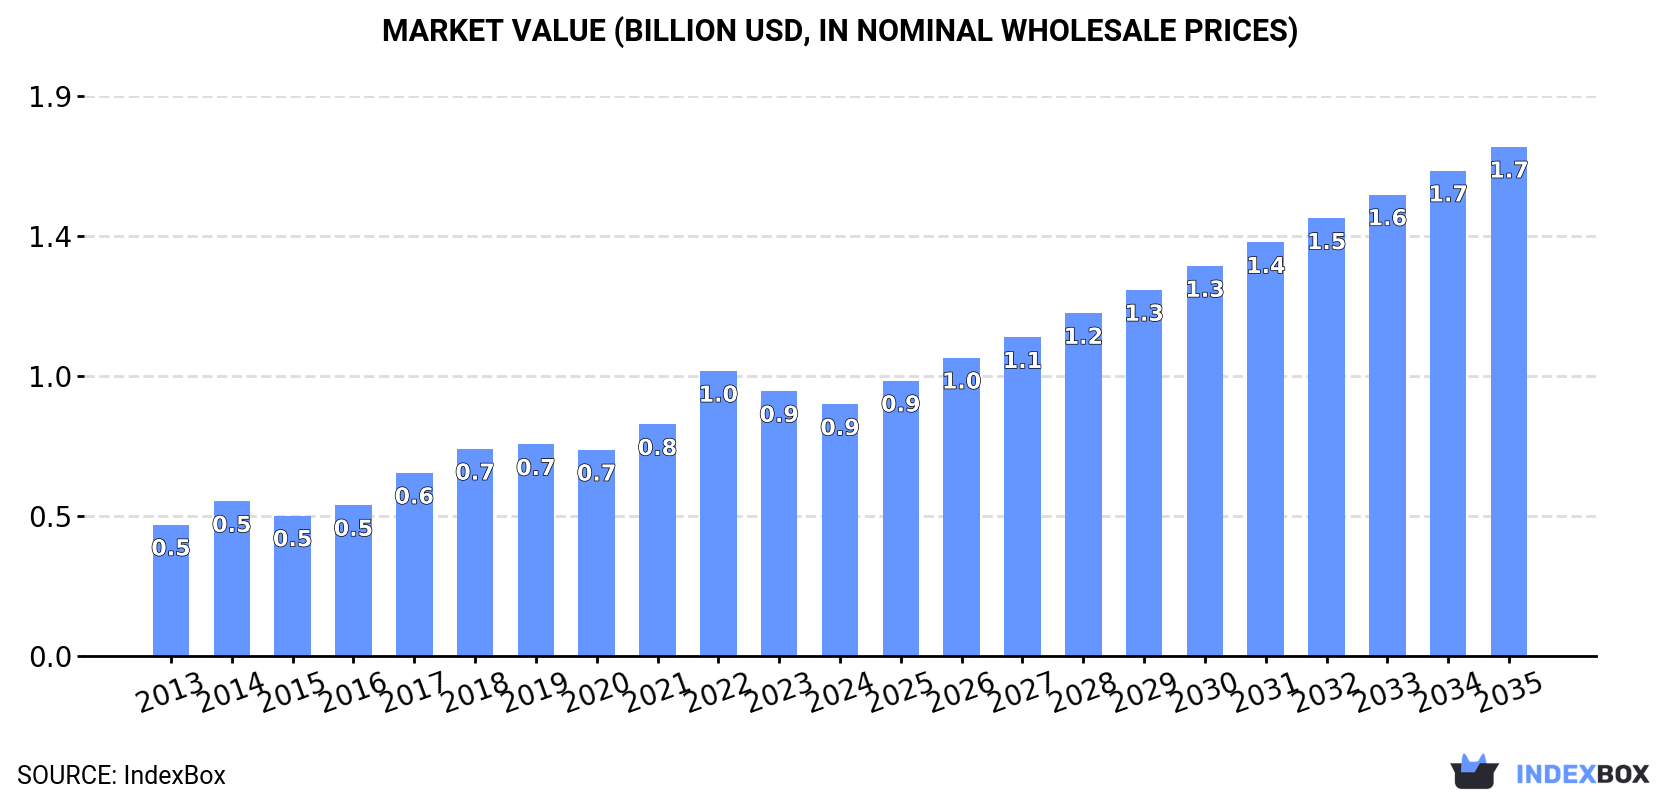
China’s golf equipment market is projected to grow at a CAGR of +6.4% in volume and +6.6% in value from 2024 to 2035, reaching 1.2 billion units and $1.7 billion respectively by 2035. Despite a slight consumption decline in 2024 to 618 million units, domestic production surged 14% to 2.3 billion units, making China a net exporter. Imports rose 3.8% to 181 million units, primarily from Hong Kong SAR (56% share), while exports reached 1.9 billion units, mainly to the United States. The market shows strong production capacity with declining import dependency and expanding export opportunities.
Key Findings
Market forecast to grow at 6.4% volume CAGR and 6.6% value CAGR through 2035China produced 2.3B units but consumed only 618M units in 2024, indicating massive export orientationHong Kong SAR dominates imports with 56% share while United States is top export destinationGolf equipment other than clubs and balls constitutes 92% of imports and 79% of exportsSignificant price disparities exist with complete golf clubs costing $104 per unit versus $1.1 for other equipmentMarket Forecast
Driven by increasing demand for golf clubs and other golf equipment in China, the market is expected to continue an upward consumption trend over the next decade. Market performance is forecast to accelerate, expanding with an anticipated CAGR of +6.4% for the period from 2024 to 2035, which is projected to bring the market volume to 1.2B units by the end of 2035.
In value terms, the market is forecast to increase with an anticipated CAGR of +6.6% for the period from 2024 to 2035, which is projected to bring the market value to $1.7B (in nominal wholesale prices) by the end of 2035.
 ConsumptionChina’s Consumption of Golf Clubs And Other Golf Equipment
In 2024, after eleven years of growth, there was decline in consumption of golf clubs and other golf equipment, when its volume decreased by -0.1% to 618M units. The total consumption volume increased at an average annual rate of +3.1% over the period from 2013 to 2024; however, the trend pattern indicated some noticeable fluctuations being recorded throughout the analyzed period. The growth pace was the most rapid in 2017 when the consumption volume increased by 7.6%. Golf equipment consumption peaked at 619M units in 2023, and then shrank slightly in the following year.
The revenue of the golf equipment market in China shrank slightly to $863M in 2024, with a decrease of -5% against the previous year. This figure reflects the total revenues of producers and importers (excluding logistics costs, retail marketing costs, and retailers’ margins, which will be included in the final consumer price). In general, the total consumption indicated a prominent increase from 2013 to 2024: its value increased at an average annual rate of +6.1% over the last eleven-year period. The trend pattern, however, indicated some noticeable fluctuations being recorded throughout the analyzed period. Based on 2024 figures, consumption decreased by -11.7% against 2022 indices. As a result, consumption reached the peak level of $977M. From 2023 to 2024, the growth of the market remained at a somewhat lower figure.
ProductionChina’s Production of Golf Clubs And Other Golf Equipment
In 2024, the amount of golf clubs and other golf equipment produced in China expanded significantly to 2.3B units, surging by 14% against 2023 figures. In general, the total production indicated a strong increase from 2013 to 2024: its volume increased at an average annual rate of +5.4% over the last eleven years. The trend pattern, however, indicated some noticeable fluctuations being recorded throughout the analyzed period. The most prominent rate of growth was recorded in 2021 when the production volume increased by 34% against the previous year. Over the period under review, production hit record highs in 2024 and is likely to continue growth in the near future.
In value terms, golf equipment production dropped slightly to $1.6B in 2024 estimated in export price. Overall, production showed a relatively flat trend pattern. The growth pace was the most rapid in 2021 with an increase of 50% against the previous year. Golf equipment production peaked at $2.3B in 2022; however, from 2023 to 2024, production remained at a lower figure.
ImportsChina’s Imports of Golf Clubs And Other Golf Equipment
In 2024, purchases abroad of golf clubs and other golf equipment increased by 3.8% to 181M units for the first time since 2021, thus ending a two-year declining trend. Overall, imports, however, recorded a deep downturn. The pace of growth was the most pronounced in 2021 when imports increased by 62% against the previous year. Over the period under review, imports hit record highs at 330M units in 2013; however, from 2014 to 2024, imports stood at a somewhat lower figure.
In value terms, golf equipment imports dropped slightly to $225M in 2024. Over the period under review, imports, however, recorded a pronounced slump. The most prominent rate of growth was recorded in 2021 when imports increased by 73% against the previous year. Imports peaked at $612M in 2014; however, from 2015 to 2024, imports remained at a lower figure.
Imports By Country
In 2024, Hong Kong SAR (100M units) constituted the largest supplier of golf equipment to China, with a 56% share of total imports. Moreover, golf equipment imports from Hong Kong SAR exceeded the figures recorded by the second-largest supplier, Japan (36M units), threefold. Thailand (17M units) ranked third in terms of total imports with a 9.5% share.
From 2013 to 2024, the average annual growth rate of volume from Hong Kong SAR amounted to -6.5%. The remaining supplying countries recorded the following average annual rates of imports growth: Japan (+4.7% per year) and Thailand (+7.0% per year).
In value terms, Hong Kong SAR ($129M) constituted the largest supplier of golf clubs and other golf equipment to China, comprising 58% of total imports. The second position in the ranking was taken by Japan ($43M), with a 19% share of total imports. It was followed by Thailand, with a 7.7% share.
From 2013 to 2024, the average annual growth rate of value from Hong Kong SAR amounted to +1.6%. The remaining supplying countries recorded the following average annual rates of imports growth: Japan (-5.8% per year) and Thailand (+2.2% per year).
Imports By Type
In 2024, golf equipment; other than clubs and balls (167M units) was the main type of golf clubs and other golf equipment supplied to China, accounting for a 92% share of total imports. Moreover, golf equipment; other than clubs and balls exceeded the figures recorded for the second-largest type, golf balls (14M units), more than tenfold.
From 2013 to 2024, the average annual growth rate of the volume of golf equipment; other than clubs and balls imports amounted to -5.7%. With regard to the other supplied products, the following average annual rates of growth were recorded: golf balls (+1.3% per year) and golf clubs; complete (-9.7% per year).
In value terms, golf equipment; other than clubs and balls ($175M) constituted the largest type of golf clubs and other golf equipment supplied to China, comprising 76% of total imports. The second position in the ranking was held by golf clubs; complete ($34M), with a 15% share of total imports.
From 2013 to 2024, the average annual rate of growth in terms of the value of golf equipment; other than clubs and balls imports amounted to -2.5%. With regard to the other supplied products, the following average annual rates of growth were recorded: golf clubs; complete (-11.4% per year) and golf balls (+3.5% per year).
Import Prices By Type
In 2024, the average golf equipment import price amounted to $1.2 per unit, falling by -4.6% against the previous year. In general, the import price, however, recorded a relatively flat trend pattern. The growth pace was the most rapid in 2014 an increase of 94%. As a result, import price reached the peak level of $2.2 per unit. From 2015 to 2024, the average import prices remained at a lower figure.
There were significant differences in the average prices amongst the major supplied products. In 2024, the product with the highest price was golf clubs; complete ($104 per unit), while the price for golf equipment; other than clubs and balls ($1.1 per unit) was amongst the lowest.
From 2013 to 2024, the most notable rate of growth in terms of prices was attained by golf equipment; other than clubs and balls (+3.4%), while the prices for the other products experienced mixed trend patterns.
Import Prices By Country
The average golf equipment import price stood at $1.2 per unit in 2024, which is down by -4.6% against the previous year. In general, the import price, however, continues to indicate a relatively flat trend pattern. The most prominent rate of growth was recorded in 2014 an increase of 94%. As a result, import price attained the peak level of $2.2 per unit. From 2015 to 2024, the average import prices remained at a somewhat lower figure.
There were significant differences in the average prices amongst the major supplying countries. In 2024, amid the top importers, the country with the highest price was the United States ($1.7 per unit), while the price for South Korea ($971 per thousand units) was amongst the lowest.
From 2013 to 2024, the most notable rate of growth in terms of prices was attained by Hong Kong SAR (+8.6%), while the prices for the other major suppliers experienced more modest paces of growth.
ExportsChina’s Exports of Golf Clubs And Other Golf Equipment
In 2024, overseas shipments of golf clubs and other golf equipment were finally on the rise to reach 1.9B units for the first time since 2021, thus ending a two-year declining trend. Over the period under review, exports recorded a perceptible increase. The most prominent rate of growth was recorded in 2021 with an increase of 53%. Over the period under review, the exports attained the maximum in 2024 and are expected to retain growth in the immediate term.
In value terms, golf equipment exports expanded slightly to $1.3B in 2024. Overall, exports, however, continue to indicate a relatively flat trend pattern. The growth pace was the most rapid in 2021 with an increase of 71% against the previous year. Over the period under review, the exports reached the peak figure at $1.9B in 2022; however, from 2023 to 2024, the exports remained at a lower figure.
Exports By Country
The United States (188M units) was the main destination for golf equipment exports from China, accounting for a 9.8% share of total exports. Moreover, golf equipment exports to the United States exceeded the volume sent to the second major destination, South Korea (65M units), threefold. The UK (37M units) ranked third in terms of total exports with a 2% share.
From 2013 to 2024, the average annual rate of growth in terms of volume to the United States amounted to -7.6%. Exports to the other major destinations recorded the following average annual rates of exports growth: South Korea (+6.7% per year) and the UK (-5.5% per year).
In value terms, the United States ($161M) remains the key foreign market for golf clubs and other golf equipment exports from China, comprising 12% of total exports. The second position in the ranking was taken by Japan ($80M), with a 6.1% share of total exports. It was followed by South Korea, with a 4.5% share.
From 2013 to 2024, the average annual rate of growth in terms of value to the United States totaled -7.6%. Exports to the other major destinations recorded the following average annual rates of exports growth: Japan (-5.6% per year) and South Korea (+7.3% per year).
Exports By Type
Golf equipment; other than clubs and balls (1.5B units) was the largest type of golf clubs and other golf equipment exported from China, with a 79% share of total exports. Moreover, golf equipment; other than clubs and balls exceeded the volume of the second product type, golf balls (375M units), fourfold.
From 2013 to 2024, the average annual growth rate of the volume of golf equipment; other than clubs and balls exports stood at +4.4%. With regard to the other exported products, the following average annual rates of growth were recorded: golf balls (+4.7% per year) and golf clubs; complete (-4.8% per year).
In value terms, golf equipment; other than clubs and balls ($839M) remains the largest type of golf clubs and other golf equipment exported from China, comprising 64% of total exports. The second position in the ranking was held by golf clubs; complete ($318M), with a 24% share of total exports.
From 2013 to 2024, the average annual growth rate of the value of golf equipment; other than clubs and balls exports amounted to +2.9%. With regard to the other exported products, the following average annual rates of growth were recorded: golf clubs; complete (-7.0% per year) and golf balls (+6.4% per year).
Export Prices By Type
The average golf equipment export price stood at $684 per thousand units in 2024, falling by -12.5% against the previous year. Over the period under review, the export price saw a noticeable descent. The growth pace was the most rapid in 2017 an increase of 31%. The export price peaked at $1.3 per unit in 2014; however, from 2015 to 2024, the export prices stood at a somewhat lower figure.
There were significant differences in the average prices for the major types of exported product. In 2024, the product with the highest price was golf clubs; complete ($17 per unit), while the average price for exports of golf balls ($393 per thousand units) was amongst the lowest.
From 2013 to 2024, the most notable rate of growth in terms of prices was recorded for the following types: golf balls (+1.6%), while the prices for the other products experienced a decline.
Export Prices By Country
In 2024, the average golf equipment export price amounted to $684 per thousand units, shrinking by -12.5% against the previous year. Over the period under review, the export price showed a pronounced shrinkage. The pace of growth appeared the most rapid in 2017 when the average export price increased by 31% against the previous year. The export price peaked at $1.3 per unit in 2014; however, from 2015 to 2024, the export prices stood at a somewhat lower figure.
Prices varied noticeably by country of destination: amid the top suppliers, the country with the highest price was Hong Kong SAR ($15 per unit), while the average price for exports to Mexico ($396 per thousand units) was amongst the lowest.
From 2013 to 2024, the most notable rate of growth in terms of prices was recorded for supplies to Hong Kong SAR (+20.6%), while the prices for the other major destinations experienced more modest paces of growth.
Source: IndexBox Market Intelligence Platform


