

Jun 29, 2025
IndexBox has just published a new report: Asia – Golf Clubs And Other Golf Equipment – Market Analysis, Forecast, Size, Trends and Insights.
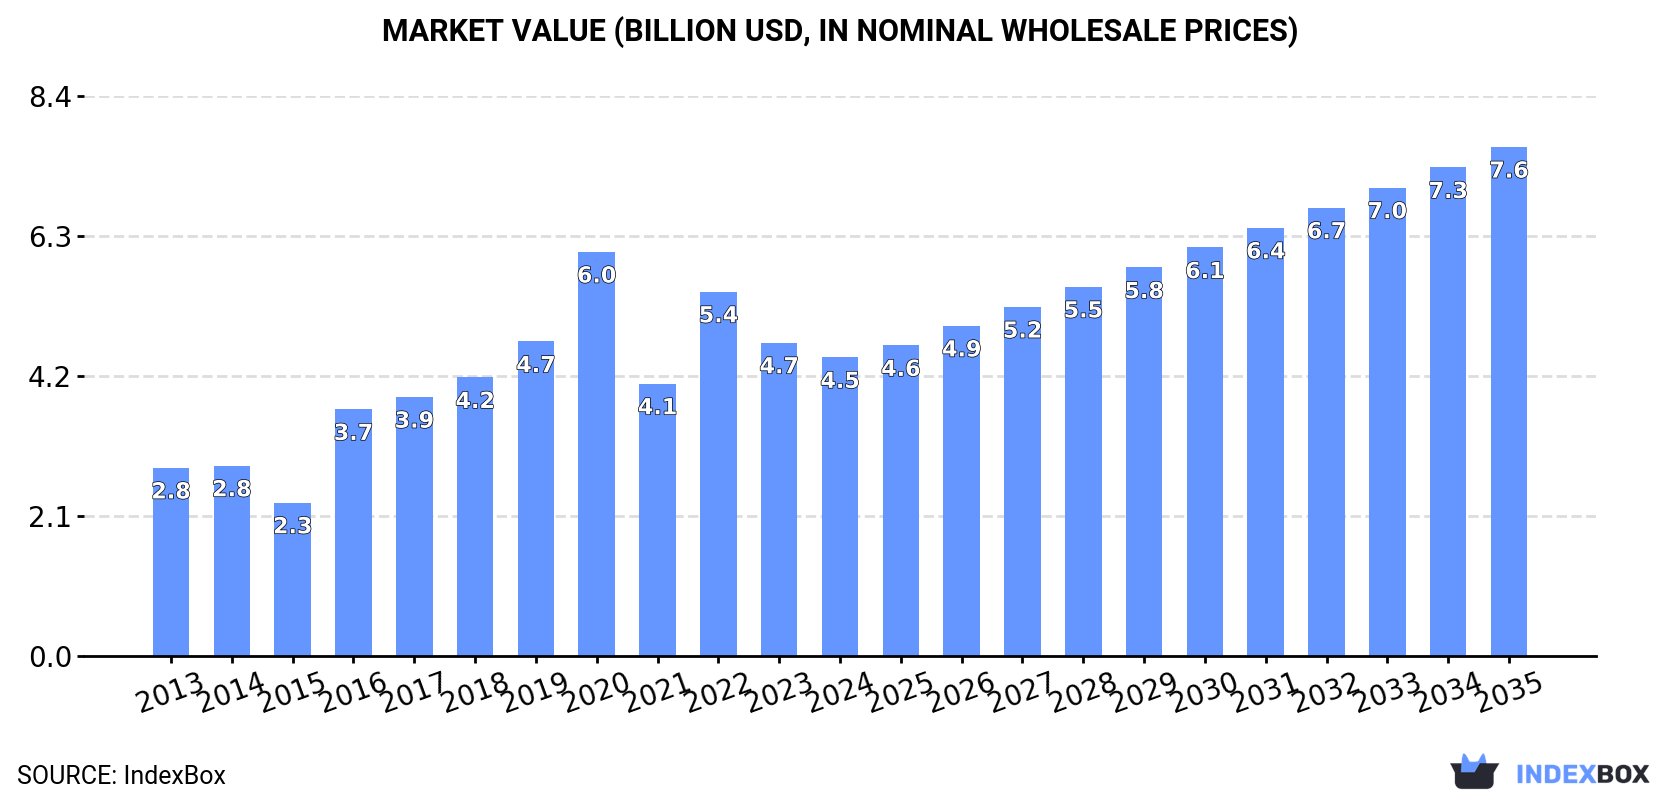
The golf equipment market in Asia is anticipated to see a steady rise in demand, particularly for golf clubs and related gear. A forecasted CAGR of +3.0% in volume and +5.0% in value from 2024 to 2035 suggests a promising future for the industry. By the end of 2035, market volume is expected to reach 4.6 billion units and market value to hit $7.6 billion, indicating a lucrative market outlook for investors and businesses in the golf sector.
Market Forecast
Driven by increasing demand for golf clubs and other golf equipment in Asia, the market is expected to continue an upward consumption trend over the next decade. Market performance is forecast to accelerate, expanding with an anticipated CAGR of +3.0% for the period from 2024 to 2035, which is projected to bring the market volume to 4.6B units by the end of 2035.
In value terms, the market is forecast to increase with an anticipated CAGR of +5.0% for the period from 2024 to 2035, which is projected to bring the market value to $7.6B (in nominal wholesale prices) by the end of 2035.
 ConsumptionAsia’s Consumption of Golf Clubs And Other Golf Equipment
In 2024, golf equipment consumption in Asia amounted to 3.3B units, approximately mirroring 2023. The total consumption indicated a moderate expansion from 2013 to 2024: its volume increased at an average annual rate of +2.0% over the last eleven-year period. The trend pattern, however, indicated some noticeable fluctuations being recorded throughout the analyzed period. Based on 2024 figures, consumption increased by +3.4% against 2021 indices. The volume of consumption peaked at 5.1B units in 2020; however, from 2021 to 2024, consumption stood at a somewhat lower figure.
The size of the golf equipment market in Asia contracted slightly to $4.5B in 2024, reducing by -4.6% against the previous year. This figure reflects the total revenues of producers and importers (excluding logistics costs, retail marketing costs, and retailers’ margins, which will be included in the final consumer price). In general, consumption posted tangible growth. The level of consumption peaked at $6B in 2020; however, from 2021 to 2024, consumption remained at a lower figure.
Consumption By Country
The country with the largest volume of golf equipment consumption was India (1.6B units), accounting for 47% of total volume. Moreover, golf equipment consumption in India exceeded the figures recorded by the second-largest consumer, China (630M units), twofold. Japan (334M units) ranked third in terms of total consumption with a 10% share.
In India, golf equipment consumption expanded at an average annual rate of +7.1% over the period from 2013-2024. The remaining consuming countries recorded the following average annual rates of consumption growth: China (+3.2% per year) and Japan (-2.5% per year).
In value terms, India ($2.1B) led the market, alone. The second position in the ranking was held by China ($869M). It was followed by Japan.
In India, the golf equipment market increased at an average annual rate of +9.2% over the period from 2013-2024. The remaining consuming countries recorded the following average annual rates of market growth: China (+6.2% per year) and Japan (-0.6% per year).
The countries with the highest levels of golf equipment per capita consumption in 2024 were Japan (2.7 units per person), South Korea (2.3 units per person) and India (1.1 units per person).
From 2013 to 2024, the biggest increases were recorded for South Korea (with a CAGR of +7.5%), while consumption for the other leaders experienced more modest paces of growth.
ProductionAsia’s Production of Golf Clubs And Other Golf Equipment
In 2024, the amount of golf clubs and other golf equipment produced in Asia rose remarkably to 5.7B units, increasing by 8.6% compared with the year before. The total production indicated a noticeable increase from 2013 to 2024: its volume increased at an average annual rate of +3.5% over the last eleven-year period. The trend pattern, however, indicated some noticeable fluctuations being recorded throughout the analyzed period. Based on 2024 figures, production decreased by -12.0% against 2020 indices. The pace of growth was the most pronounced in 2020 when the production volume increased by 34% against the previous year. As a result, production attained the peak volume of 6.5B units. From 2021 to 2024, production growth failed to regain momentum.
In value terms, golf equipment production soared to $4.9B in 2024 estimated in export price. The total production indicated a slight increase from 2013 to 2024: its value increased at an average annual rate of +1.7% over the last eleven-year period. The trend pattern, however, indicated some noticeable fluctuations being recorded throughout the analyzed period. Based on 2024 figures, production decreased by -13.3% against 2022 indices. The pace of growth was the most pronounced in 2021 with an increase of 33% against the previous year. Over the period under review, production reached the maximum level at $5.7B in 2022; however, from 2023 to 2024, production stood at a somewhat lower figure.
Production By Country
The countries with the highest volumes of production in 2024 were China (2.4B units), India (1.5B units) and Taiwan (Chinese) (706M units), with a combined 81% share of total production. Vietnam, Pakistan, Indonesia and Japan lagged somewhat behind, together accounting for a further 13%.
From 2013 to 2024, the biggest increases were recorded for Vietnam (with a CAGR of +18.3%), while production for the other leaders experienced more modest paces of growth.
ImportsAsia’s Imports of Golf Clubs And Other Golf Equipment
In 2024, approx. 1.3B units of golf clubs and other golf equipment were imported in Asia; reducing by -4.5% against the previous year. Over the period under review, imports recorded a perceptible curtailment. The pace of growth was the most pronounced in 2021 with an increase of 47%. The volume of import peaked at 1.8B units in 2013; however, from 2014 to 2024, imports stood at a somewhat lower figure.
In value terms, golf equipment imports reduced to $2.3B in 2024. In general, imports continue to indicate a slight setback. The growth pace was the most rapid in 2021 with an increase of 50%. Over the period under review, imports reached the maximum at $3.5B in 2022; however, from 2023 to 2024, imports stood at a somewhat lower figure.
Imports By Country
Japan (349M units) and Hong Kong SAR (310M units) represented roughly 52% of total imports in 2024. South Korea (202M units) took the next position in the ranking, followed by China (184M units) and Vietnam (91M units). All these countries together took approx. 37% share of total imports. The following importers – Taiwan (Chinese) (50M units) and Malaysia (44M units) – together made up 7.4% of total imports.
From 2013 to 2024, the most notable rate of growth in terms of purchases, amongst the key importing countries, was attained by Taiwan (Chinese) (with a CAGR of +11.0%), while imports for the other leaders experienced more modest paces of growth.
In value terms, Japan ($670M), South Korea ($558M) and Hong Kong SAR ($553M) were the countries with the highest levels of imports in 2024, together comprising 78% of total imports. China, Vietnam, Taiwan (Chinese) and Malaysia lagged somewhat behind, together accounting for a further 17%.
Vietnam, with a CAGR of +17.4%, saw the highest growth rate of the value of imports, among the main importing countries over the period under review, while purchases for the other leaders experienced more modest paces of growth.
Imports By Type
Golf equipment; other than clubs and balls was the major imported product with an import of about 1B units, which recorded 81% of total imports. It was distantly followed by golf balls (237M units), achieving a 19% share of total imports.
From 2013 to 2024, average annual rates of growth with regard to golf equipment; other than clubs and balls imports of stood at -3.7%. At the same time, golf balls (+1.9%) displayed positive paces of growth. Moreover, golf balls emerged as the fastest-growing type imported in Asia, with a CAGR of +1.9% from 2013-2024. Golf balls (+7.7 p.p.) significantly strengthened its position in terms of the total imports, while golf equipment; other than clubs and balls saw its share reduced by -7.2% from 2013 to 2024, respectively.
In value terms, golf equipment; other than clubs and balls ($1.3B), golf clubs; complete ($743M) and golf balls ($285M) constituted the products with the highest levels of imports in 2024.
In terms of the main imported products, golf balls, with a CAGR of +2.9%, saw the highest growth rate of the value of imports, over the period under review, while purchases for the other products experienced mixed trends in the imports figures.
Import Prices By Type
In 2024, the import price in Asia amounted to $1.8 per unit, shrinking by -6.6% against the previous year. Over the period from 2013 to 2024, it increased at an average annual rate of +1.9%. The pace of growth was the most pronounced in 2022 an increase of 20%. As a result, import price reached the peak level of $2.1 per unit. From 2023 to 2024, the import prices failed to regain momentum.
There were significant differences in the average prices amongst the major imported products. In 2024, the product with the highest price was golf clubs; complete ($90 per unit), while the price for golf balls ($1.2 per unit) was amongst the lowest.
From 2013 to 2024, the most notable rate of growth in terms of prices was attained by golf equipment; other than clubs and balls (+4.6%), while the other products experienced more modest paces of growth.
Import Prices By Country
In 2024, the import price in Asia amounted to $1.8 per unit, which is down by -6.6% against the previous year. Over the last eleven years, it increased at an average annual rate of +1.9%. The most prominent rate of growth was recorded in 2022 an increase of 20%. As a result, import price attained the peak level of $2.1 per unit. From 2023 to 2024, the import prices failed to regain momentum.
Prices varied noticeably by country of destination: amid the top importers, the country with the highest price was South Korea ($2.8 per unit), while Malaysia ($726 per thousand units) was amongst the lowest.
From 2013 to 2024, the most notable rate of growth in terms of prices was attained by Vietnam (+5.8%), while the other leaders experienced more modest paces of growth.
ExportsAsia’s Exports of Golf Clubs And Other Golf Equipment
Golf equipment exports rose markedly to 3.7B units in 2024, increasing by 11% compared with 2023. Total exports indicated slight growth from 2013 to 2024: its volume increased at an average annual rate of +1.8% over the last eleven years. The trend pattern, however, indicated some noticeable fluctuations being recorded throughout the analyzed period. Based on 2024 figures, exports decreased by -8.4% against 2022 indices. The most prominent rate of growth was recorded in 2021 when exports increased by 50% against the previous year. Over the period under review, the exports hit record highs at 4.1B units in 2022; however, from 2023 to 2024, the exports remained at a lower figure.
In value terms, golf equipment exports amounted to $4.1B in 2024. In general, exports saw a slight increase. The most prominent rate of growth was recorded in 2021 when exports increased by 63%. Over the period under review, the exports reached the peak figure at $5.4B in 2022; however, from 2023 to 2024, the exports stood at a somewhat lower figure.
Exports By Country
China represented the main exporting country with an export of about 1.9B units, which amounted to 52% of total exports. Taiwan (Chinese) (748M units) held a 20% share (based on physical terms) of total exports, which put it in second place, followed by Vietnam (12%) and Hong Kong SAR (7.5%). The following exporters – Japan (109M units), South Korea (85M units) and Thailand (73M units) – together made up 7.2% of total exports.
From 2013 to 2024, average annual rates of growth with regard to golf equipment exports from China stood at +4.2%. At the same time, Vietnam (+19.0%), South Korea (+8.3%), Taiwan (Chinese) (+2.7%) and Japan (+1.3%) displayed positive paces of growth. Moreover, Vietnam emerged as the fastest-growing exporter exported in Asia, with a CAGR of +19.0% from 2013-2024. By contrast, Thailand (-3.5%) and Hong Kong SAR (-10.0%) illustrated a downward trend over the same period. China (+12 p.p.), Vietnam (+10 p.p.) and Taiwan (Chinese) (+1.9 p.p.) significantly strengthened its position in terms of the total exports, while Thailand and Hong Kong SAR saw its share reduced by -1.6% and -21.5% from 2013 to 2024, respectively. The shares of the other countries remained relatively stable throughout the analyzed period.
In value terms, the largest golf equipment supplying countries in Asia were China ($1.3B), Vietnam ($793M) and Taiwan (Chinese) ($756M), together accounting for 69% of total exports.
Vietnam, with a CAGR of +21.4%, recorded the highest growth rate of the value of exports, in terms of the main exporting countries over the period under review, while shipments for the other leaders experienced more modest paces of growth.
Exports By Type
In 2024, golf equipment; other than clubs and balls (2.7B units) was the key type of golf clubs and other golf equipment, creating 73% of total exports. It was distantly followed by golf balls (983M units), making up a 26% share of total exports.
Golf equipment; other than clubs and balls experienced a relatively flat trend pattern with regard to volume of exports. At the same time, golf balls (+5.0%) displayed positive paces of growth. Moreover, golf balls emerged as the fastest-growing type exported in Asia, with a CAGR of +5.0% from 2013-2024. While the share of golf balls (+7.7 p.p.) increased significantly in terms of the total exports from 2013-2024, the share of golf equipment; other than clubs and balls (-7 p.p.) displayed negative dynamics.
In value terms, the largest types of exported golf clubs and other golf equipment were golf equipment; other than clubs and balls ($2.3B), golf clubs; complete ($1.2B) and golf balls ($599M).
In terms of the main exported products, golf balls, with a CAGR of +5.3%, saw the highest growth rate of the value of exports, over the period under review, while shipments for the other products experienced mixed trends in the exports figures.
Export Prices By Type
In 2024, the export price in Asia amounted to $1.1 per unit, with a decrease of -8.9% against the previous year. Overall, the export price recorded a relatively flat trend pattern. The most prominent rate of growth was recorded in 2014 when the export price increased by 14%. Over the period under review, the export prices attained the peak figure at $1.3 per unit in 2022; however, from 2023 to 2024, the export prices stood at a somewhat lower figure.
There were significant differences in the average prices amongst the major exported products. In 2024, the product with the highest price was golf clubs; complete ($39 per unit), while the average price for exports of golf balls ($610 per thousand units) was amongst the lowest.
From 2013 to 2024, the most notable rate of growth in terms of prices was attained by golf equipment; other than clubs and balls (+2.5%), while the other products experienced more modest paces of growth.
Export Prices By Country
In 2024, the export price in Asia amounted to $1.1 per unit, which is down by -8.9% against the previous year. Over the period under review, the export price continues to indicate a relatively flat trend pattern. The most prominent rate of growth was recorded in 2014 when the export price increased by 14%. The level of export peaked at $1.3 per unit in 2022; however, from 2023 to 2024, the export prices stood at a somewhat lower figure.
Prices varied noticeably by country of origin: amid the top suppliers, the country with the highest price was Japan ($3 per unit), while China ($674 per thousand units) was amongst the lowest.
From 2013 to 2024, the most notable rate of growth in terms of prices was attained by Hong Kong SAR (+6.6%), while the other leaders experienced more modest paces of growth.
Source: IndexBox Market Intelligence Platform


