

Oct 3, 2025
IndexBox has just published a new report: Asia – Golf Clubs And Other Golf Equipment – Market Analysis, Forecast, Size, Trends and Insights.
This comprehensive analysis details the Asia golf equipment market, which consumed 3.2 billion units valued at $4.5 billion in 2024. Driven by demand, the market is forecast to grow to 4.4 billion units ($6.3 billion) by 2035. India is the largest consumer (1.5B units, $2.1B), while China is the top producer (2.3B units). Regional trade is significant, with imports at 1.3B units and exports at 3.7B units. The report provides in-depth data on consumption, production, import/export volumes and values, prices, and country-level breakdowns for key markets like Japan, South Korea, Vietnam, and Taiwan.
Key Findings
Asia’s golf equipment market is projected to grow to 4.4B units and $6.3B by 2035India is the dominant consumer, accounting for 47% of regional volume and leading in market valueChina is the largest producer and exporter, responsible for over half of Asia’s export volumeThe region is a net exporter, with 2024 exports of 3.7B units significantly exceeding imports of 1.3B unitsVietnam shows the most dynamic growth in both production and export value among major countriesMarket Forecast
Driven by increasing demand for golf clubs and other golf equipment in Asia, the market is expected to continue an upward consumption trend over the next decade. Market performance is forecast to accelerate, expanding with an anticipated CAGR of +2.9% for the period from 2024 to 2035, which is projected to bring the market volume to 4.4B units by the end of 2035.
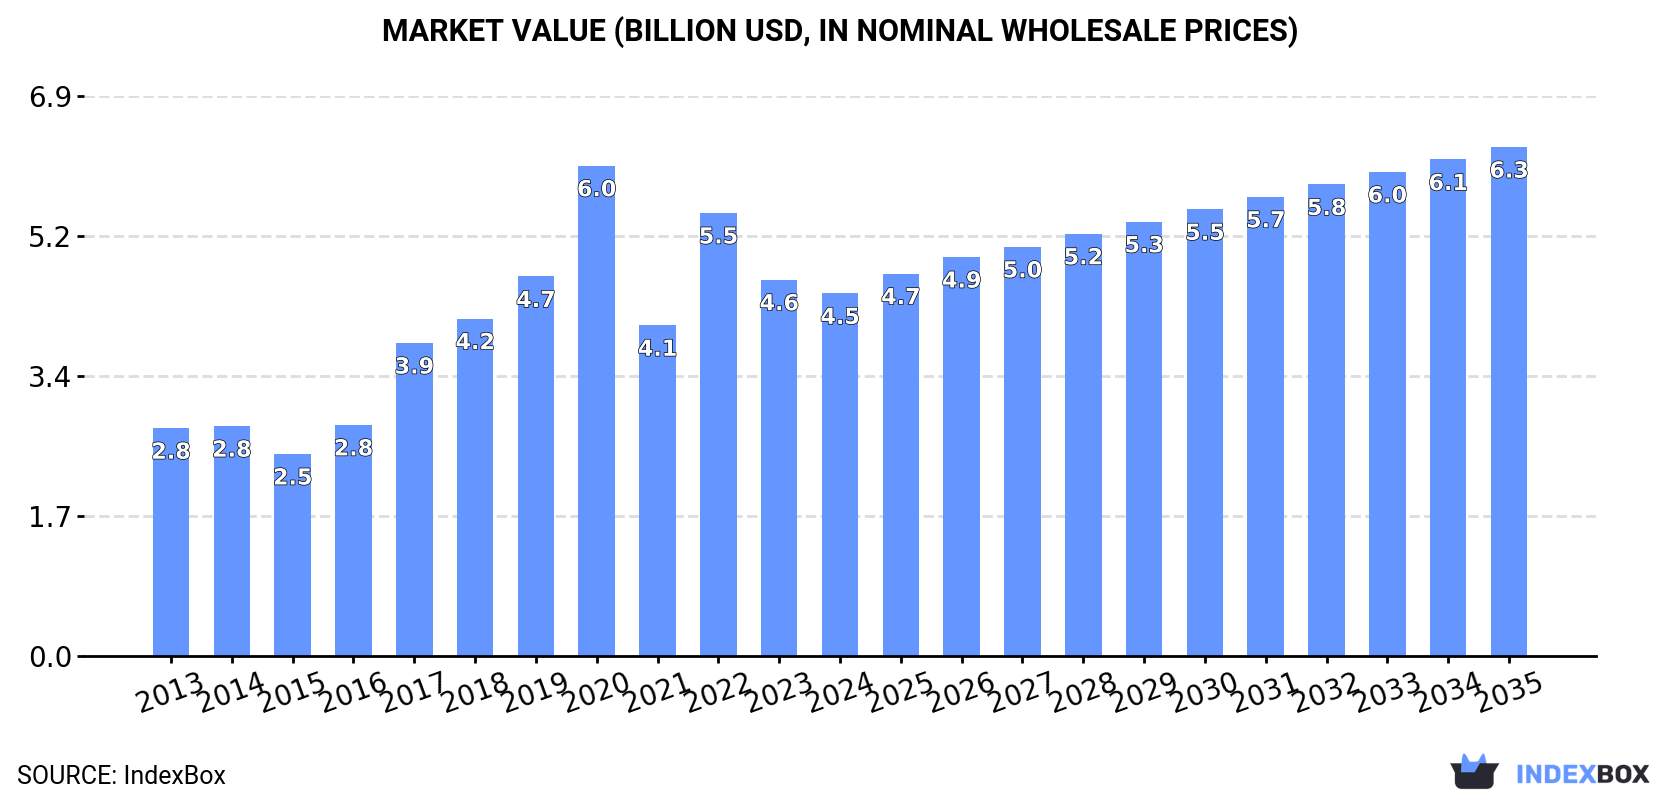
In value terms, the market is forecast to increase with an anticipated CAGR of +3.1% for the period from 2024 to 2035, which is projected to bring the market value to $6.3B (in nominal wholesale prices) by the end of 2035.
 ConsumptionAsia’s Consumption of Golf Clubs And Other Golf Equipment
In 2024, the amount of golf clubs and other golf equipment consumed in Asia stood at 3.2B units, approximately mirroring the previous year. The total consumption indicated a tangible expansion from 2013 to 2024: its volume increased at an average annual rate of +2.1% over the last eleven years. The trend pattern, however, indicated some noticeable fluctuations being recorded throughout the analyzed period. Based on 2024 figures, consumption increased by +3.8% against 2021 indices. As a result, consumption reached the peak volume of 5B units. From 2021 to 2024, the growth of the consumption failed to regain momentum.
The size of the golf equipment market in Asia dropped slightly to $4.5B in 2024, which is down by -3.6% against the previous year. This figure reflects the total revenues of producers and importers (excluding logistics costs, retail marketing costs, and retailers’ margins, which will be included in the final consumer price). Over the period under review, consumption enjoyed a notable increase. The level of consumption peaked at $6B in 2020; however, from 2021 to 2024, consumption failed to regain momentum.
Consumption By Country
India (1.5B units) remains the largest golf equipment consuming country in Asia, accounting for 47% of total volume. Moreover, golf equipment consumption in India exceeded the figures recorded by the second-largest consumer, China (618M units), twofold. Japan (329M units) ranked third in terms of total consumption with a 10% share.
In India, golf equipment consumption expanded at an average annual rate of +7.2% over the period from 2013-2024. In the other countries, the average annual rates were as follows: China (+3.1% per year) and Japan (-2.5% per year).
In value terms, India ($2.1B) led the market, alone. The second position in the ranking was held by China ($863M). It was followed by Japan.
In India, the golf equipment market expanded at an average annual rate of +9.3% over the period from 2013-2024. The remaining consuming countries recorded the following average annual rates of market growth: China (+6.1% per year) and Japan (-0.6% per year).
The countries with the highest levels of golf equipment per capita consumption in 2024 were Japan (2.7 units per person), South Korea (2.2 units per person) and India (1.1 units per person).
From 2013 to 2024, the most notable rate of growth in terms of consumption, amongst the key consuming countries, was attained by South Korea (with a CAGR of +7.5%), while consumption for the other leaders experienced more modest paces of growth.
ProductionAsia’s Production of Golf Clubs And Other Golf Equipment
In 2024, approx. 5.7B units of golf clubs and other golf equipment were produced in Asia; with an increase of 9.5% on the previous year. The total production indicated a temperate increase from 2013 to 2024: its volume increased at an average annual rate of +3.6% over the last eleven-year period. The trend pattern, however, indicated some noticeable fluctuations being recorded throughout the analyzed period. Based on 2024 figures, production decreased by -11.2% against 2020 indices. The most prominent rate of growth was recorded in 2020 with an increase of 34%. As a result, production attained the peak volume of 6.4B units. From 2021 to 2024, production growth remained at a somewhat lower figure.
In value terms, golf equipment production rose notably to $4.6B in 2024 estimated in export price. The total production indicated a modest expansion from 2013 to 2024: its value increased at an average annual rate of +1.2% over the last eleven years. The trend pattern, however, indicated some noticeable fluctuations being recorded throughout the analyzed period. Based on 2024 figures, production decreased by -17.6% against 2022 indices. The most prominent rate of growth was recorded in 2021 with an increase of 32% against the previous year. The level of production peaked at $5.6B in 2022; however, from 2023 to 2024, production failed to regain momentum.
Production By Country
The countries with the highest volumes of production in 2024 were China (2.3B units), India (1.5B units) and Taiwan (Chinese) (701M units), with a combined 80% share of total production. Vietnam, Pakistan, Thailand and Indonesia lagged somewhat behind, together accounting for a further 14%.
From 2013 to 2024, the most notable rate of growth in terms of production, amongst the leading producing countries, was attained by Vietnam (with a CAGR of +18.2%), while production for the other leaders experienced more modest paces of growth.
ImportsAsia’s Imports of Golf Clubs And Other Golf Equipment
For the third year in a row, Asia recorded decline in supplies from abroad of golf clubs and other golf equipment, which decreased by -3.4% to 1.3B units in 2024. Overall, imports recorded a noticeable contraction. The pace of growth appeared the most rapid in 2021 when imports increased by 47% against the previous year. The volume of import peaked at 1.7B units in 2013; however, from 2014 to 2024, imports stood at a somewhat lower figure.
In value terms, golf equipment imports reduced to $2.3B in 2024. Over the period under review, imports recorded a mild downturn. The growth pace was the most rapid in 2021 with an increase of 50%. The level of import peaked at $3.5B in 2022; however, from 2023 to 2024, imports failed to regain momentum.
Imports By Country
In 2024, Japan (344M units) and Hong Kong SAR (304M units) represented the main importers of golf clubs and other golf equipment in Asia, together committing 50% of total imports. South Korea (200M units) ranks next in terms of the total imports with a 16% share, followed by China (14%) and Vietnam (6.9%). Taiwan (Chinese) (50M units) and Malaysia (43M units) followed a long way behind the leaders.
From 2013 to 2024, the most notable rate of growth in terms of purchases, amongst the leading importing countries, was attained by Taiwan (Chinese) (with a CAGR of +11.1%), while imports for the other leaders experienced more modest paces of growth.
In value terms, Japan ($670M), South Korea ($558M) and Hong Kong SAR ($553M) appeared to be the countries with the highest levels of imports in 2024, together accounting for 77% of total imports. China, Vietnam, Taiwan (Chinese) and Malaysia lagged somewhat behind, together comprising a further 17%.
In terms of the main importing countries, Vietnam, with a CAGR of +17.4%, recorded the highest growth rate of the value of imports, over the period under review, while purchases for the other leaders experienced more modest paces of growth.
Imports By Type
Golf equipment; other than clubs and balls was the main imported product with an import of around 1B units, which recorded 81% of total imports. It was distantly followed by golf balls (240M units), creating a 19% share of total imports.
Imports of golf equipment; other than clubs and balls decreased at an average annual rate of -3.5% from 2013 to 2024. At the same time, golf balls (+2.1%) displayed positive paces of growth. Moreover, golf balls emerged as the fastest-growing type imported in Asia, with a CAGR of +2.1% from 2013-2024. From 2013 to 2024, the share of golf balls increased by +7.7 percentage points.
In value terms, the largest types of imported golf clubs and other golf equipment were golf equipment; other than clubs and balls ($1.3B), golf clubs; complete ($749M) and golf balls ($287M).
Golf balls, with a CAGR of +3.0%, recorded the highest rates of growth with regard to the value of imports, among the main imported products over the period under review, while purchases for the other products experienced mixed trends in the imports figures.
Import Prices By Type
In 2024, the import price in Asia amounted to $1.8 per unit, which is down by -7.2% against the previous year. Over the last eleven years, it increased at an average annual rate of +1.7%. The most prominent rate of growth was recorded in 2022 when the import price increased by 20%. As a result, import price reached the peak level of $2.1 per unit. From 2023 to 2024, the import prices remained at a lower figure.
There were significant differences in the average prices amongst the major imported products. In 2024, the product with the highest price was golf clubs; complete ($90 per unit), while the price for golf balls ($1.2 per unit) was amongst the lowest.
From 2013 to 2024, the most notable rate of growth in terms of prices was attained by golf equipment; other than clubs and balls (+4.4%), while the other products experienced more modest paces of growth.
Import Prices By Country
In 2024, the import price in Asia amounted to $1.8 per unit, shrinking by -7.2% against the previous year. Over the period from 2013 to 2024, it increased at an average annual rate of +1.7%. The growth pace was the most rapid in 2022 an increase of 20%. As a result, import price attained the peak level of $2.1 per unit. From 2023 to 2024, the import prices remained at a lower figure.
Prices varied noticeably by country of destination: amid the top importers, the country with the highest price was South Korea ($2.8 per unit), while Malaysia ($736 per thousand units) was amongst the lowest.
From 2013 to 2024, the most notable rate of growth in terms of prices was attained by Vietnam (+5.8%), while the other leaders experienced more modest paces of growth.
ExportsAsia’s Exports of Golf Clubs And Other Golf Equipment
In 2024, exports of golf clubs and other golf equipment in Asia expanded significantly to 3.7B units, with an increase of 12% compared with 2023. Total exports indicated a slight increase from 2013 to 2024: its volume increased at an average annual rate of +1.9% over the last eleven years. The trend pattern, however, indicated some noticeable fluctuations being recorded throughout the analyzed period. Based on 2024 figures, exports decreased by -6.7% against 2022 indices. The growth pace was the most rapid in 2021 with an increase of 50%. Over the period under review, the exports hit record highs at 4B units in 2022; however, from 2023 to 2024, the exports failed to regain momentum.
In value terms, golf equipment exports expanded slightly to $4.2B in 2024. Overall, exports showed slight growth. The pace of growth appeared the most rapid in 2021 when exports increased by 63%. Over the period under review, the exports reached the maximum at $5.4B in 2022; however, from 2023 to 2024, the exports remained at a lower figure.
Exports By Country
China was the major exporter of golf clubs and other golf equipment in Asia, with the volume of exports resulting at 1.9B units, which was approx. 51% of total exports in 2024. Taiwan (Chinese) (743M units) ranks second in terms of the total exports with a 20% share, followed by Vietnam (12%) and Hong Kong SAR (7.4%). The following exporters – Thailand (129M units), Japan (108M units) and South Korea (85M units) – together made up 8.6% of total exports.
Exports from China increased at an average annual rate of +4.3% from 2013 to 2024. At the same time, Vietnam (+18.9%), South Korea (+8.4%), Taiwan (Chinese) (+2.7%), Thailand (+1.8%) and Japan (+1.3%) displayed positive paces of growth. Moreover, Vietnam emerged as the fastest-growing exporter exported in Asia, with a CAGR of +18.9% from 2013-2024. By contrast, Hong Kong SAR (-10.0%) illustrated a downward trend over the same period. China (+11 p.p.), Vietnam (+9.9 p.p.) and Taiwan (Chinese) (+1.6 p.p.) significantly strengthened its position in terms of the total exports, while Hong Kong SAR saw its share reduced by -21.6% from 2013 to 2024, respectively. The shares of the other countries remained relatively stable throughout the analyzed period.
In value terms, the largest golf equipment supplying countries in Asia were China ($1.3B), Vietnam ($793M) and Taiwan (Chinese) ($756M), with a combined 69% share of total exports.
Among the main exporting countries, Vietnam, with a CAGR of +21.4%, saw the highest rates of growth with regard to the value of exports, over the period under review, while shipments for the other leaders experienced more modest paces of growth.
Exports By Type
In 2024, golf equipment; other than clubs and balls (2.7B units) represented the largest type of golf clubs and other golf equipment, committing 73% of total exports. It was distantly followed by golf balls (987M units), achieving a 26% share of total exports.
From 2013 to 2024, average annual rates of growth with regard to golf equipment; other than clubs and balls exports of stood at +1.1%. At the same time, golf balls (+5.1%) displayed positive paces of growth. Moreover, golf balls emerged as the fastest-growing type exported in Asia, with a CAGR of +5.1% from 2013-2024. From 2013 to 2024, the share of golf balls increased by +7.5 percentage points.
In value terms, the largest types of exported golf clubs and other golf equipment were golf equipment; other than clubs and balls ($2.3B), golf clubs; complete ($1.2B) and golf balls ($627M).
Golf balls, with a CAGR of +5.7%, recorded the highest growth rate of the value of exports, among the main exported products over the period under review, while shipments for the other products experienced mixed trends in the exports figures.
Export Prices By Type
In 2024, the export price in Asia amounted to $1.1 per unit, declining by -8.7% against the previous year. In general, the export price recorded a relatively flat trend pattern. The most prominent rate of growth was recorded in 2014 an increase of 14%. Over the period under review, the export prices reached the maximum at $1.4 per unit in 2022; however, from 2023 to 2024, the export prices stood at a somewhat lower figure.
Prices varied noticeably by the product type; the product with the highest price was golf clubs; complete ($39 per unit), while the average price for exports of golf balls ($636 per thousand units) was amongst the lowest.
From 2013 to 2024, the most notable rate of growth in terms of prices was attained by golf equipment; other than clubs and balls (+2.4%), while the other products experienced more modest paces of growth.
Export Prices By Country
In 2024, the export price in Asia amounted to $1.1 per unit, reducing by -8.7% against the previous year. Overall, the export price continues to indicate a relatively flat trend pattern. The pace of growth appeared the most rapid in 2014 when the export price increased by 14% against the previous year. The level of export peaked at $1.4 per unit in 2022; however, from 2023 to 2024, the export prices stood at a somewhat lower figure.
Prices varied noticeably by country of origin: amid the top suppliers, the country with the highest price was Japan ($3.1 per unit), while China ($684 per thousand units) was amongst the lowest.
From 2013 to 2024, the most notable rate of growth in terms of prices was attained by Hong Kong SAR (+6.6%), while the other leaders experienced more modest paces of growth.
Source: IndexBox Market Intelligence Platform


