

Sep 3, 2025
IndexBox has just published a new report: World – Golf Clubs And Other Golf Equipment – Market Analysis, Forecast, Size, Trends and Insights.
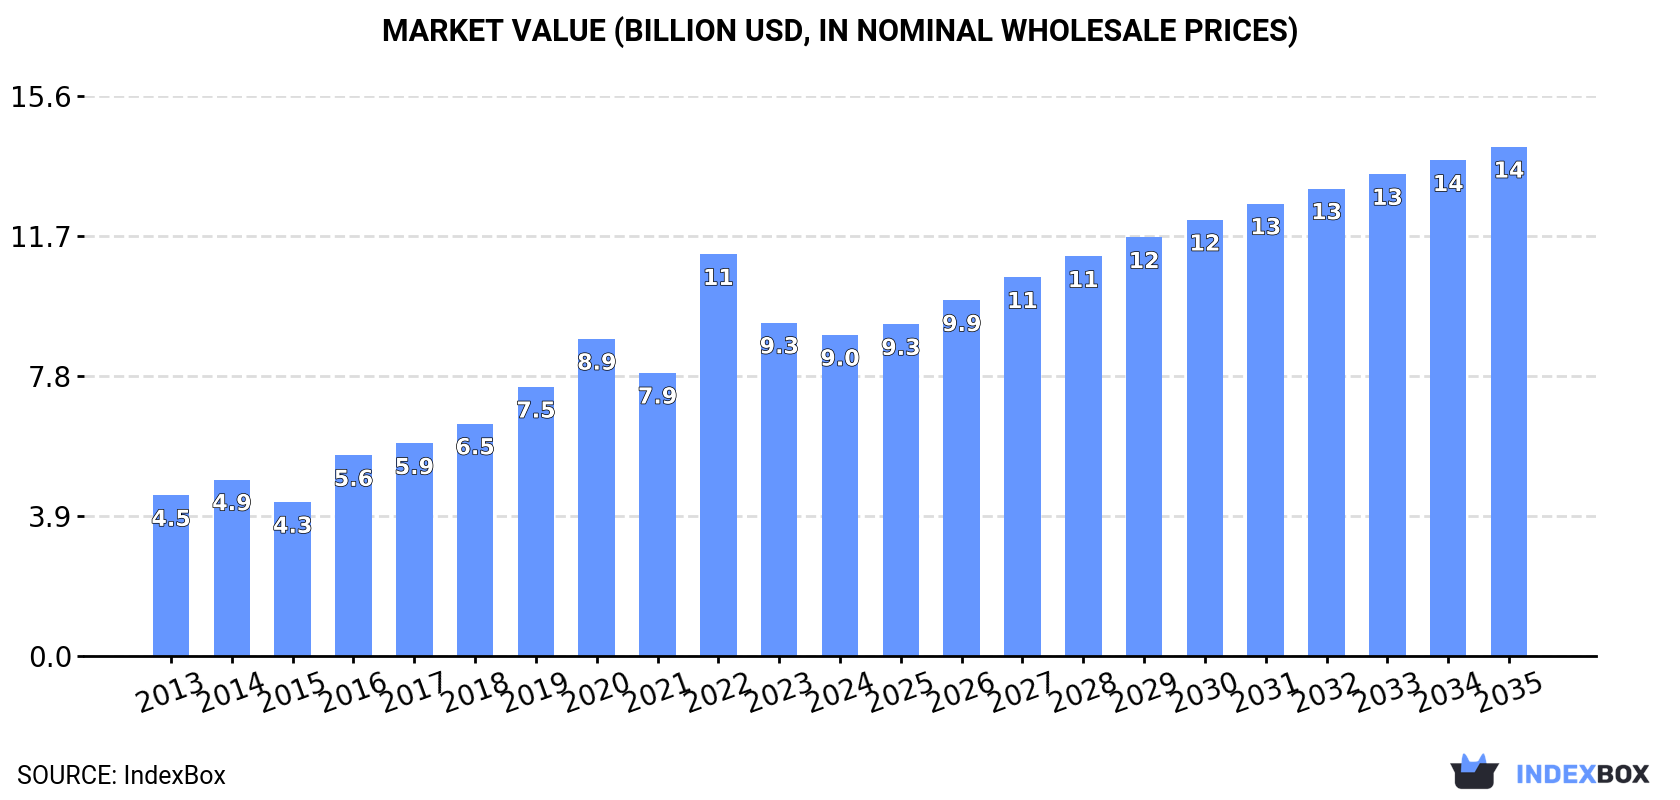
The article discusses the projected growth of the golf equipment market over the next decade, attributing it to rising demand globally. It forecasts a +2.8% CAGR in volume, bringing market volume to 9.1B units by 2035, and a +4.3% CAGR in value, reaching $14.2B by the same year.
Market Forecast
Driven by increasing demand for golf clubs and other golf equipment worldwide, the market is expected to continue an upward consumption trend over the next decade. Market performance is forecast to decelerate, expanding with an anticipated CAGR of +2.8% for the period from 2024 to 2035, which is projected to bring the market volume to 9.1B units by the end of 2035.
In value terms, the market is forecast to increase with an anticipated CAGR of +4.3% for the period from 2024 to 2035, which is projected to bring the market value to $14.2B (in nominal wholesale prices) by the end of 2035.
 ConsumptionWorld’s Consumption of Golf Clubs And Other Golf Equipment
In 2024, global golf equipment consumption amounted to 6.7B units, increasing by 2.3% against 2023 figures. Overall, the total consumption indicated pronounced growth from 2013 to 2024: its volume increased at an average annual rate of +4.3% over the last eleven-year period. The trend pattern, however, indicated some noticeable fluctuations being recorded throughout the analyzed period. Based on 2024 figures, consumption decreased by -10.9% against 2020 indices. As a result, consumption reached the peak volume of 7.5B units. From 2021 to 2024, the growth of the global consumption remained at a lower figure.
The global golf equipment market revenue dropped slightly to $9B in 2024, shrinking by -3.7% against the previous year. This figure reflects the total revenues of producers and importers (excluding logistics costs, retail marketing costs, and retailers’ margins, which will be included in the final consumer price). Over the period under review, consumption showed a buoyant increase. As a result, consumption attained the peak level of $11.2B. From 2023 to 2024, the growth of the global market remained at a lower figure.
Consumption By Country
The countries with the highest volumes of consumption in 2024 were the United States (1.9B units), India (1.6B units) and China (630M units), together comprising 62% of global consumption.
From 2013 to 2024, the biggest increases were recorded for the United States (with a CAGR of +13.8%), while consumption for the other global leaders experienced more modest paces of growth.
In value terms, the United States ($2.7B), India ($2.1B) and China ($869M) constituted the countries with the highest levels of market value in 2024, together comprising 63% of the global market.
In terms of the main consuming countries, the United States, with a CAGR of +16.1%, recorded the highest growth rate of market size over the period under review, while market for the other global leaders experienced more modest paces of growth.
The countries with the highest levels of golf equipment per capita consumption in 2024 were the United States (5.7 units per person), the UK (3.7 units per person) and Japan (2.7 units per person).
From 2013 to 2024, the biggest increases were recorded for the United States (with a CAGR of +13.1%), while consumption for the other global leaders experienced more modest paces of growth.
ProductionWorld’s Production of Golf Clubs And Other Golf Equipment
Global golf equipment production was estimated at 6.4B units in 2024, growing by 6.7% against the year before. Over the period under review, the total production indicated a pronounced increase from 2013 to 2024: its volume increased at an average annual rate of +3.3% over the last eleven-year period. The trend pattern, however, indicated some noticeable fluctuations being recorded throughout the analyzed period. Based on 2024 figures, production decreased by -11.3% against 2020 indices. The most prominent rate of growth was recorded in 2020 when the production volume increased by 32%. As a result, production attained the peak volume of 7.2B units. From 2021 to 2024, global production growth remained at a lower figure.
In value terms, golf equipment production expanded significantly to $5.6B in 2024 estimated in export price. Overall, production showed a modest increase. The pace of growth was the most pronounced in 2021 with an increase of 1,349%. As a result, production reached the peak level of $63.3B. From 2022 to 2024, global production growth remained at a somewhat lower figure.
Production By Country
The countries with the highest volumes of production in 2024 were China (2.4B units), India (1.5B units) and Taiwan (Chinese) (706M units), together accounting for 72% of global production. Vietnam, Pakistan, Nigeria and Indonesia lagged somewhat behind, together accounting for a further 12%.
From 2013 to 2024, the biggest increases were recorded for Vietnam (with a CAGR of +18.3%), while production for the other global leaders experienced more modest paces of growth.
ImportsWorld’s Imports of Golf Clubs And Other Golf Equipment
In 2024, global golf equipment imports expanded slightly to 4.5B units, surging by 1.6% compared with the year before. Overall, total imports indicated a noticeable increase from 2013 to 2024: its volume increased at an average annual rate of +2.0% over the last eleven-year period. The trend pattern, however, indicated some noticeable fluctuations being recorded throughout the analyzed period. Based on 2024 figures, imports decreased by -17.4% against 2022 indices. The most prominent rate of growth was recorded in 2021 with an increase of 40% against the previous year. Over the period under review, global imports attained the maximum at 5.5B units in 2022; however, from 2023 to 2024, imports failed to regain momentum.
In value terms, golf equipment imports reached $6B in 2024. Over the period under review, total imports indicated a modest increase from 2013 to 2024: its value increased at an average annual rate of +1.9% over the last eleven-year period. The trend pattern, however, indicated some noticeable fluctuations being recorded throughout the analyzed period. Based on 2024 figures, imports decreased by -23.3% against 2022 indices. The growth pace was the most rapid in 2021 with an increase of 58% against the previous year. Global imports peaked at $7.8B in 2022; however, from 2023 to 2024, imports remained at a lower figure.
Imports By Country
In 2024, the United States (2.1B units) represented the key importer of golf clubs and other golf equipment, mixing up 46% of total imports. It was distantly followed by Mexico (397M units), Japan (349M units), Hong Kong SAR (310M units) and the UK (268M units), together committing a 29% share of total imports. The following importers – South Korea (202M units), China (184M units), Vietnam (91M units) and Canada (88M units) – together made up 12% of total imports.
From 2013 to 2024, average annual rates of growth with regard to golf equipment imports into the United States stood at +7.7%. At the same time, Vietnam (+10.9%), Mexico (+8.1%), South Korea (+8.0%) and Canada (+1.1%) displayed positive paces of growth. Moreover, Vietnam emerged as the fastest-growing importer imported in the world, with a CAGR of +10.9% from 2013-2024. Japan and the UK experienced a relatively flat trend pattern. By contrast, China (-5.4%) and Hong Kong SAR (-6.4%) illustrated a downward trend over the same period. The United States (+21 p.p.), Mexico (+4.1 p.p.) and South Korea (+2.1 p.p.) significantly strengthened its position in terms of the global imports, while Japan, the UK, China and Hong Kong SAR saw its share reduced by -1.8%, -2.1%, -5.2% and -10.7% from 2013 to 2024, respectively. The shares of the other countries remained relatively stable throughout the analyzed period.
In value terms, the United States ($1.7B) constitutes the largest market for imported golf clubs and other golf equipment worldwide, comprising 28% of global imports. The second position in the ranking was taken by Japan ($670M), with an 11% share of global imports. It was followed by South Korea, with a 9.4% share.
From 2013 to 2024, the average annual growth rate of value in the United States totaled +3.6%. The remaining importing countries recorded the following average annual rates of imports growth: Japan (-1.1% per year) and South Korea (+4.6% per year).
Imports By Type
In 2024, golf equipment; other than clubs and balls (2.8B units) was the major type of golf clubs and other golf equipment, creating 61% of total imports. It was distantly followed by golf balls (1.7B units), making up a 38% share of total imports.
From 2013 to 2024, the biggest increases were recorded for golf balls (with a CAGR of +6.9%), while purchases for the other products experienced mixed trends in the imports figures.
In value terms, golf equipment; other than clubs and balls ($2.8B), golf clubs; complete ($2.1B) and golf balls ($1.1B) constituted the products with the highest levels of imports in 2024.
In terms of the main imported products, golf balls, with a CAGR of +4.1%, recorded the highest rates of growth with regard to the value of imports, over the period under review, while purchases for the other products experienced mixed trends in the imports figures.
Import Prices By Type
In 2024, the average golf equipment import price amounted to $1.3 per unit, leveling off at the previous year. In general, the import price showed a relatively flat trend pattern. The pace of growth appeared the most rapid in 2021 an increase of 13%. Over the period under review, average import prices attained the peak figure at $1.4 per unit in 2022; however, from 2023 to 2024, import prices remained at a lower figure.
Prices varied noticeably by the product type; the product with the highest price was golf clubs; complete ($72 per unit), while the price for golf balls ($617 per thousand units) was amongst the lowest.
From 2013 to 2024, the most notable rate of growth in terms of prices was attained by golf clubs; complete (+4.0%), while the other products experienced mixed trends in the import price figures.
Import Prices By Country
The average golf equipment import price stood at $1.3 per unit in 2024, almost unchanged from the previous year. Overall, the import price continues to indicate a relatively flat trend pattern. The pace of growth appeared the most rapid in 2021 when the average import price increased by 13%. Over the period under review, average import prices reached the peak figure at $1.4 per unit in 2022; however, from 2023 to 2024, import prices stood at a somewhat lower figure.
There were significant differences in the average prices amongst the major importing countries. In 2024, amid the top importers, the country with the highest price was Canada ($3.4 per unit), while the United States ($793 per thousand units) was amongst the lowest.
From 2013 to 2024, the most notable rate of growth in terms of prices was attained by Vietnam (+5.8%), while the other global leaders experienced more modest paces of growth.
ExportsWorld’s Exports of Golf Clubs And Other Golf Equipment
In 2024, shipments abroad of golf clubs and other golf equipment increased by 8.3% to 4.3B units for the first time since 2021, thus ending a two-year declining trend. In general, exports continue to indicate a relatively flat trend pattern. The most prominent rate of growth was recorded in 2021 when exports increased by 47%. As a result, the exports attained the peak of 4.9B units. From 2022 to 2024, the growth of the global exports failed to regain momentum.
In value terms, golf equipment exports rose to $5.9B in 2024. Over the period under review, exports continue to indicate temperate growth. The pace of growth was the most pronounced in 2021 when exports increased by 58%. Over the period under review, the global exports attained the maximum at $7.5B in 2022; however, from 2023 to 2024, the exports failed to regain momentum.
Exports By Country
China was the largest exporting country with an export of around 1.9B units, which finished at 45% of total exports. It was distantly followed by Taiwan (Chinese) (748M units), Vietnam (463M units) and Hong Kong SAR (281M units), together comprising a 35% share of total exports. The United States (174M units), Japan (109M units) and the Netherlands (100M units) followed a long way behind the leaders.
From 2013 to 2024, average annual rates of growth with regard to golf equipment exports from China stood at +4.2%. At the same time, Vietnam (+19.0%), the Netherlands (+5.4%), Taiwan (Chinese) (+2.7%) and Japan (+1.3%) displayed positive paces of growth. Moreover, Vietnam emerged as the fastest-growing exporter exported in the world, with a CAGR of +19.0% from 2013-2024. By contrast, the United States (-8.6%) and Hong Kong SAR (-10.0%) illustrated a downward trend over the same period. From 2013 to 2024, the share of China, Vietnam and Taiwan (Chinese) increased by +14, +9.1 and +3.4 percentage points, respectively. The shares of the other countries remained relatively stable throughout the analyzed period.
In value terms, China ($1.3B), Vietnam ($793M) and Taiwan (Chinese) ($756M) constituted the countries with the highest levels of exports in 2024, with a combined 48% share of global exports.
In terms of the main exporting countries, Vietnam, with a CAGR of +21.4%, saw the highest rates of growth with regard to the value of exports, over the period under review, while shipments for the other global leaders experienced more modest paces of growth.
Exports By Type
Golf equipment; other than clubs and balls was the main type of golf clubs and other golf equipment in the world, with the volume of exports amounting to 3B units, which was near 71% of total exports in 2024. It was distantly followed by golf balls (1.2B units), creating a 28% share of total exports.
Golf equipment; other than clubs and balls experienced a relatively flat trend pattern with regard to volume of exports. At the same time, golf balls (+4.2%) displayed positive paces of growth. Moreover, golf balls emerged as the fastest-growing type exported in the world, with a CAGR of +4.2% from 2013-2024. From 2013 to 2024, the share of golf balls increased by +8.7 percentage points.
In value terms, golf equipment; other than clubs and balls ($2.8B), golf clubs; complete ($2.2B) and golf balls ($920M) appeared to be the products with the highest levels of exports in 2024, with a combined 99.9% share of global exports.
In terms of the main exported products, golf balls, with a CAGR of +4.3%, recorded the highest rates of growth with regard to the value of exports, over the period under review, while shipments for the other products experienced more modest paces of growth.
Export Prices By Type
In 2024, the average golf equipment export price amounted to $1.4 per unit, falling by -5.6% against the previous year. Over the period from 2013 to 2024, it increased at an average annual rate of +2.0%. The most prominent rate of growth was recorded in 2016 when the average export price increased by 23%. The global export price peaked at $1.6 per unit in 2022; however, from 2023 to 2024, the export prices stood at a somewhat lower figure.
There were significant differences in the average prices amongst the major exported products. In 2024, the product with the highest price was golf clubs; complete ($51 per unit), while the average price for exports of golf balls ($781 per thousand units) was amongst the lowest.
From 2013 to 2024, the most notable rate of growth in terms of prices was attained by golf equipment; other than clubs and balls (+4.1%), while the other products experienced more modest paces of growth.
Export Prices By Country
In 2024, the average golf equipment export price amounted to $1.4 per unit, which is down by -5.6% against the previous year. Over the period from 2013 to 2024, it increased at an average annual rate of +2.0%. The growth pace was the most rapid in 2016 when the average export price increased by 23%. The global export price peaked at $1.6 per unit in 2022; however, from 2023 to 2024, the export prices failed to regain momentum.
Prices varied noticeably by country of origin: amid the top suppliers, the country with the highest price was the United States ($4.1 per unit), while China ($674 per thousand units) was amongst the lowest.
From 2013 to 2024, the most notable rate of growth in terms of prices was attained by the United States (+14.2%), while the other global leaders experienced more modest paces of growth.
Source: IndexBox Market Intelligence Platform


")
